


If your MyStatLab set keeps marking a correct answer wrong, or a step in StatCrunch has you stuck, you do not need another leaked answer key that will not match your version. You need a real statistics expert to work through the exact values on your screen and show you how to enter it the way MyStatLab expects. DoMyHomework has helped students do exactly that since 2017. You send the set, you get a free quote in about two minutes, and you only pay once you approve the price and the deadline. Human experts only, never AI.
Why your correct MyStatLab answer got marked wrong
This is the part most “MyStatLab answers” pages skip, and it is usually not a statistics problem at all. MyStatLab grades class width, midpoints, and boundaries against a strict format, not just the right number. Enter a comma-separated list with a space after the comma and it is wrong. Round a midpoint early instead of carrying the full value through and the boundary that depends on it drifts off and gets marked wrong even though your method was sound. StatCrunch output has its own quirks too, and pasting a rounded result instead of the tool’s exact figure fails the check on an otherwise correct answer.
On top of that, most MyStatLab problems are algorithmic: the platform hands you a fresh data set, often with different frequencies or spend amounts, every time you open or retry the assignment. That is exactly why a classmate’s screenshot, or a “MyStatLab answers” PDF pulled off Google, rarely lines up with the version sitting in front of you. A worked method for your exact values, entered the way MyStatLab wants, is what actually gets it marked right. If the whole course is the problem rather than one MyStatLab set, our statistics homework help page covers the subject end to end, platform or no platform.
The worked help you get for a MyStatLab set
Send us your MyStatLab homework or quiz, usually as a screenshot, and a verified statistics expert solves every problem using the numbers on your screen, then sends back the full method with each step shown, including how StatCrunch was used and how to format the final answer. You follow it, you understand it, and you enter your own answers, which is the version that still makes sense when the same topic shows up on a test.
We write every solution from scratch for the values in front of you, because a copy from another student’s set almost never matches once MyStatLab regenerates the numbers. And we keep it human. No AI, ever, because a chatbot guessing at a screenshot gets multi-step probability and hypothesis-testing problems confidently wrong, and still would not know how to format the answer for the grader either.
For a timed MyStatLab Test
A Test is usually timed and sometimes proctored, and we are not going to pretend we can sit it for you or promise you will not get caught trying. What we can do is help you prepare beforehand: worked practice problems across the exact topics your Test covers, so you walk in knowing the material and take it yourself.
Human statistics experts, and why your details stay private
MyStatLab problems go specifically to statisticians, not general math tutors who happen to also cover stats. That distinction matters here more than on most platforms, because a hypothesis test or a StatCrunch output needs someone who actually reasons in confidence intervals and p-values day to day. Every one of our 200+ experts is vetted by field, the work is original, and your details never reach your school.
Genuine errors are covered by a 30-day money-back guarantee, and revisions cost nothing. The 4.87 average across 1,790+ reviews since 2017 comes mostly from students whose class-width answer or regression line kept failing for formatting reasons that had nothing to do with their statistics, which is exactly the gap a specialist closes.
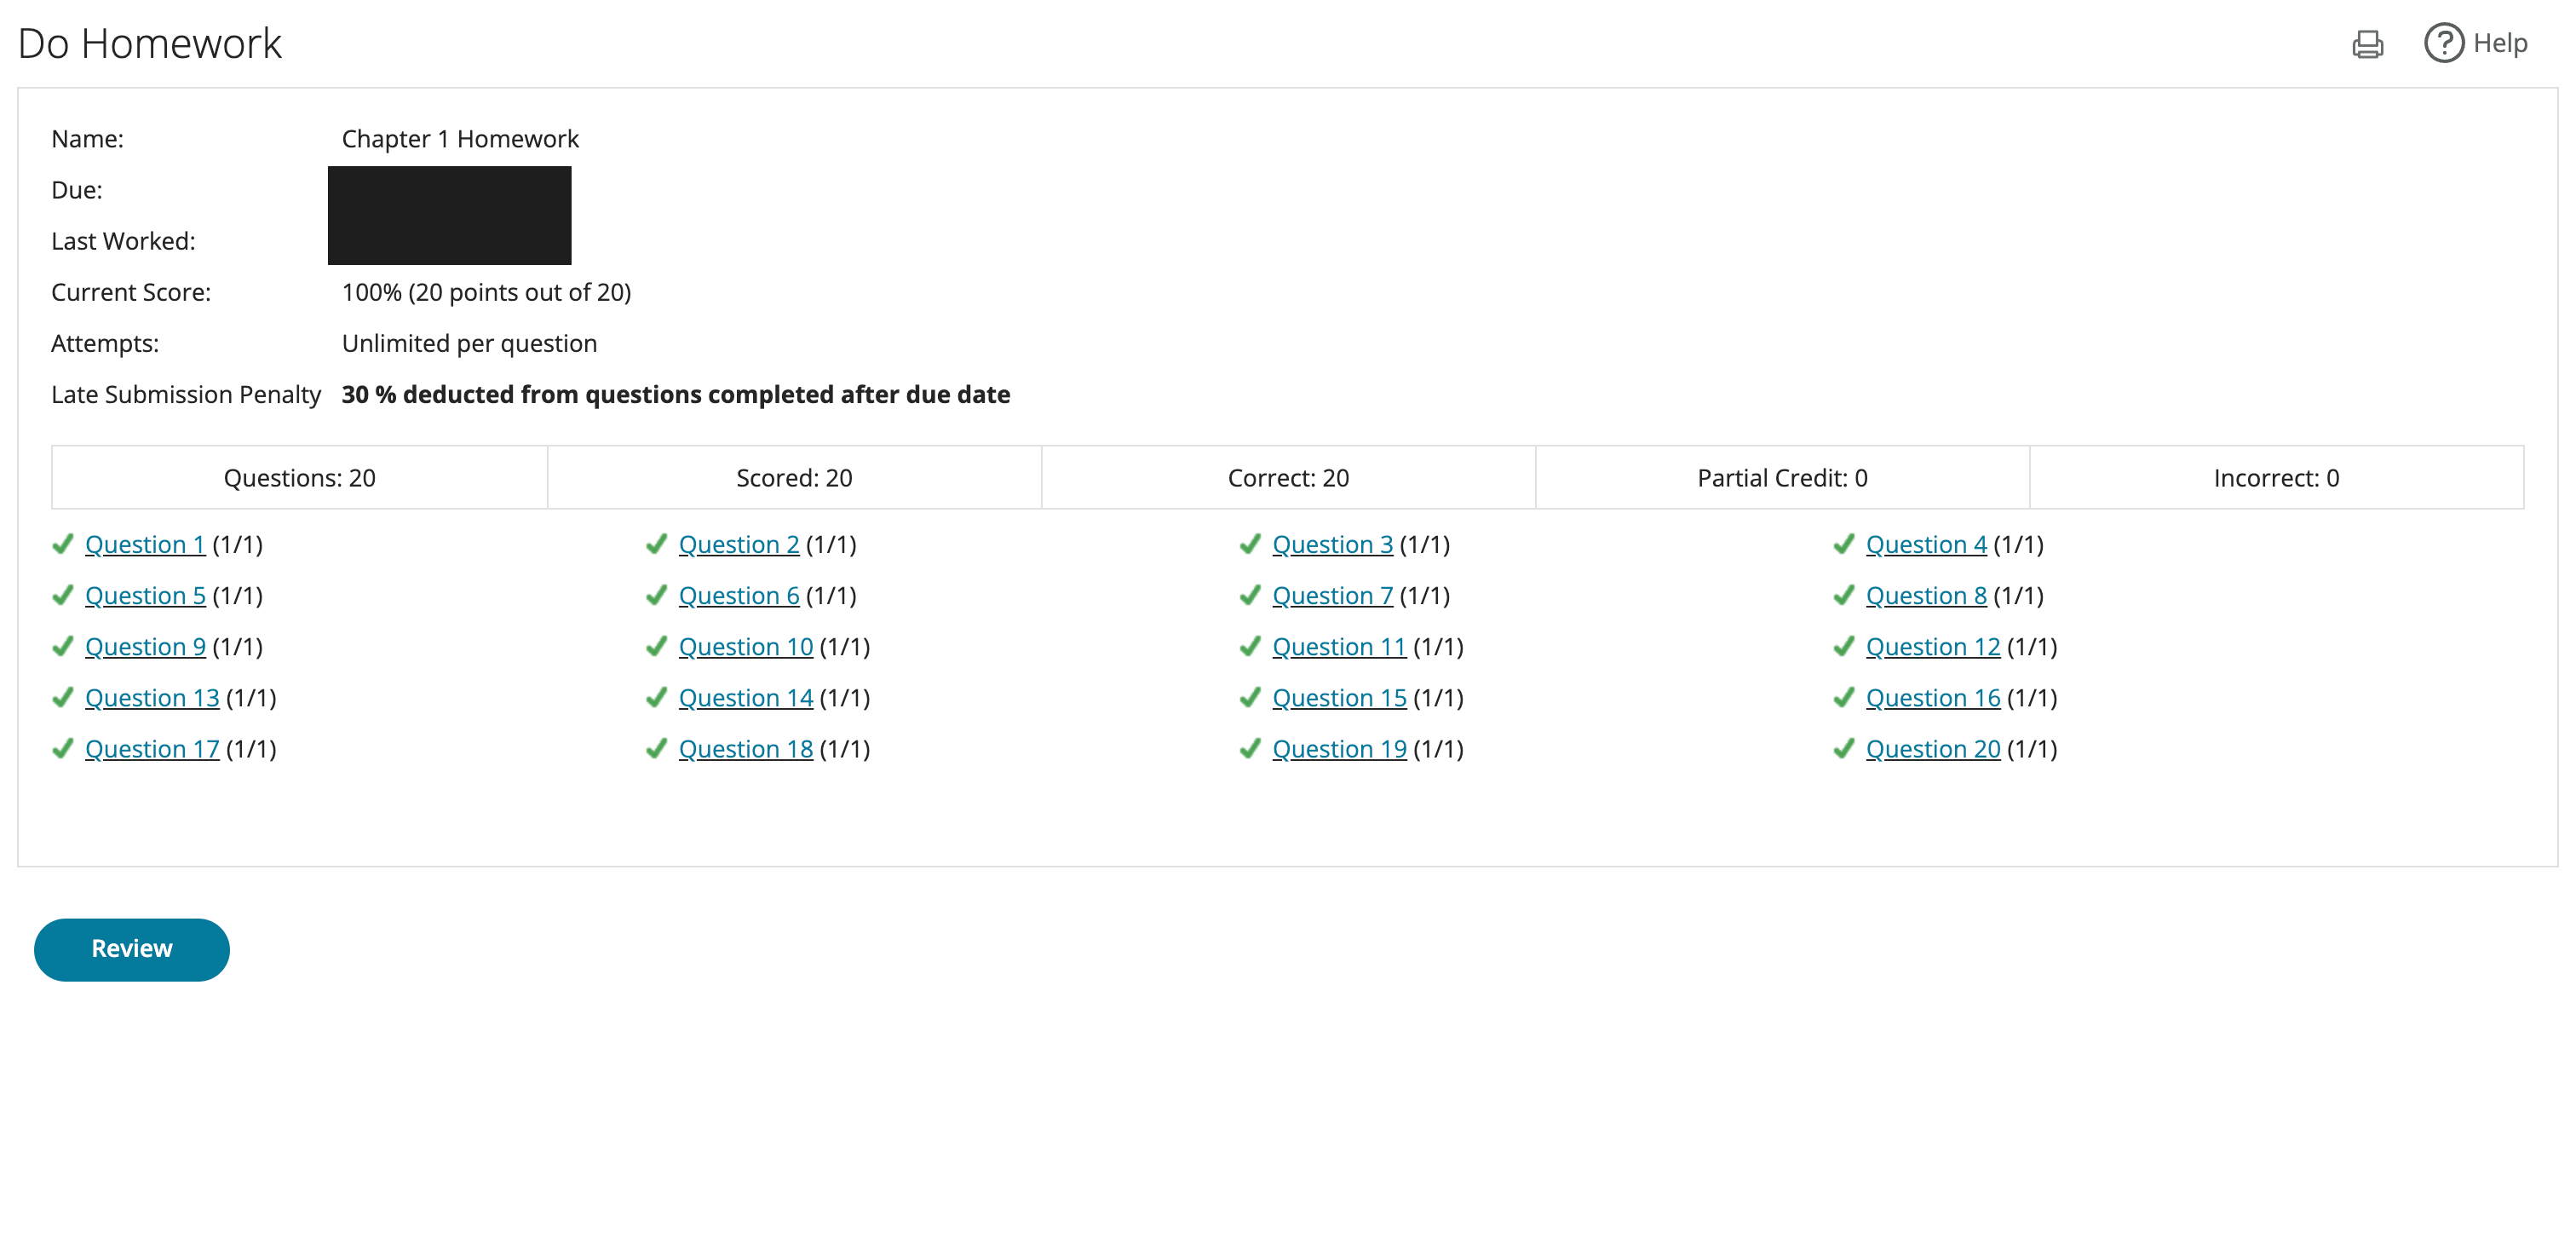
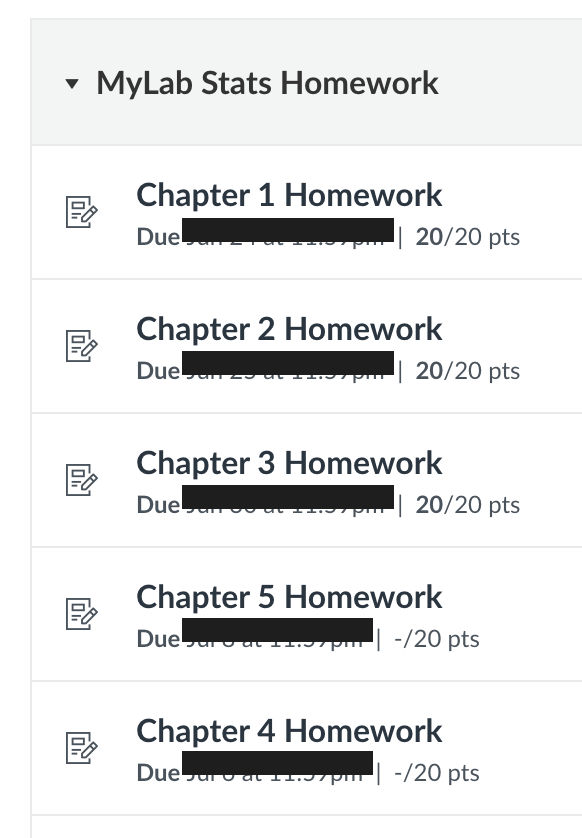
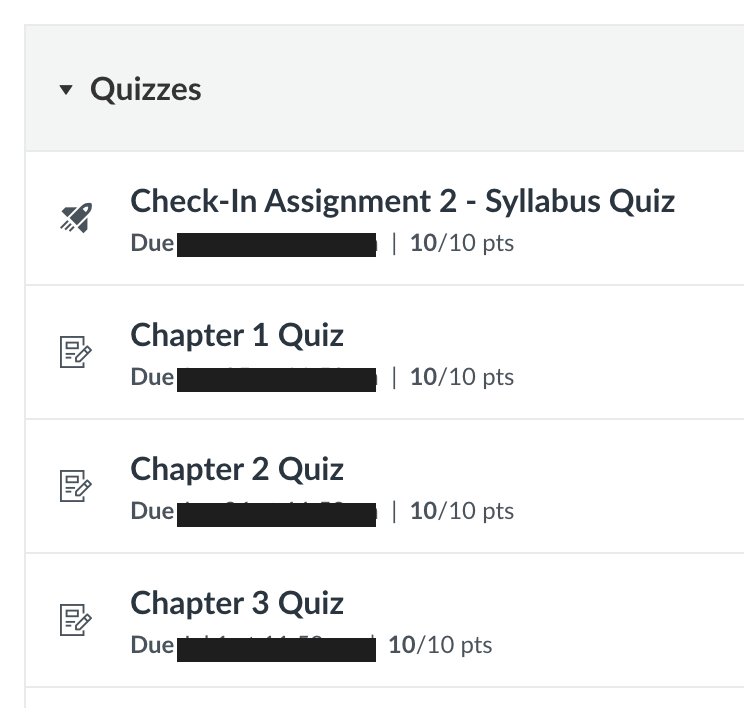
Real MyStatLab results, not a promise
These are actual screenshots from a MyStatLab course we are currently helping a student with. Due dates are blacked out to protect their privacy, everything else is exactly what MyStatLab showed after our expert’s worked solutions were submitted.

You stay in control
- Send your set
- Get a free quote
- Review the price and deadline
- Decide, no card upfront
Your school is never contacted.
There is no fixed MyStatLab answer key for your data set
If you have been searching for a MyStatLab answer key, here is the honest picture, and Pearson’s own documentation backs it up: there is no official key, because MyStatLab uses algorithmic randomization to change the numeric values in most problems for every student. A set that looks like yours by chapter and question number almost never has your exact numbers once you open it.
The MyStatLab statistics homework answers PDFs and Quizlet decks that show up in search are almost always from a different data set, a different textbook edition, or a different student’s attempt. A worked method for your exact values is what holds up, because it still applies when MyStatLab hands you a different version of the same problem tomorrow.
Same-day help, and what makes a MyStatLab set take longer
A descriptive-statistics set is usually a same-day job. Regression and hypothesis-testing sets take longer, since each StatCrunch output has to be checked by hand against what the grader actually expects, not just skimmed for a plausible-looking number. Ask about your specific deadline and you’ll get an honest answer, not an optimistic one.
What you pay for a MyStatLab set, and how the process runs
Screenshot the homework or quiz, get a free quote in about two minutes, and only pay once you’ve approved the price and deadline. A statistics expert takes it from there, formats every answer the way MyStatLab’s grader checks it, and pricing starts at $10 per page with no subscription attached.
The 30-day money-back guarantee covers it if something is genuinely wrong, revisions included at no extra cost. You’re paying for someone who can explain why a p-value came out the way it did, not a copied answer or an AI’s plausible-sounding guess.
Where MyStatLab problem sets get hardest, by topic
MyStatLab runs across the standard intro statistics sequence, bundled with the Pearson textbook your course uses. Here’s the breakdown by chapter, roughly in the order courses hit them.
Descriptive statistics and frequency distributions
Class width, midpoints, and boundaries from a frequency table, where a single formatting mistake, like a space after a comma or an early rounding step, turns a correct answer into a wrong one. This is where the mystatlab statistics homework answers searches usually start, early in the course while the format still feels unfamiliar. Get help
Probability and distributions
Binomial, normal, and Poisson distributions, worked through with StatCrunch where the platform expects it, so the setup and the final figure both match what the grader is checking for. Get help
Hypothesis testing
Null and alternative hypotheses, p-values, and significance tests, where the reasoning matters as much as the number so the setup makes sense the next time a similar question comes up. Get help
Regression and correlation
Correlation coefficients, regression lines, and what a single outlier does to both, explained so you can see why removing one data point changes the conclusion. Get help
See pricing for the full breakdown.

